



The code: https://github.com/inchoate/distr-system
Distributed systems are notoriously hard to learn from textbooks. You can memorize the definition of "backpressure" or "circuit breaking," but until you see a system struggle and recover in real-time, it’s hard to build an intuition for it.
I wanted a way to teach myself (and others) how these systems actually feel in production without the risk of breaking a real environment. So, I built a local sandbox—a production-grade distributed system that runs entirely in Docker.
It comes with a full observability stack (Grafana, Prometheus, Tempo) pre-configured. You can spin it up with one command, break specific parts of it using the Docker Dashboard, and watch the metrics react.
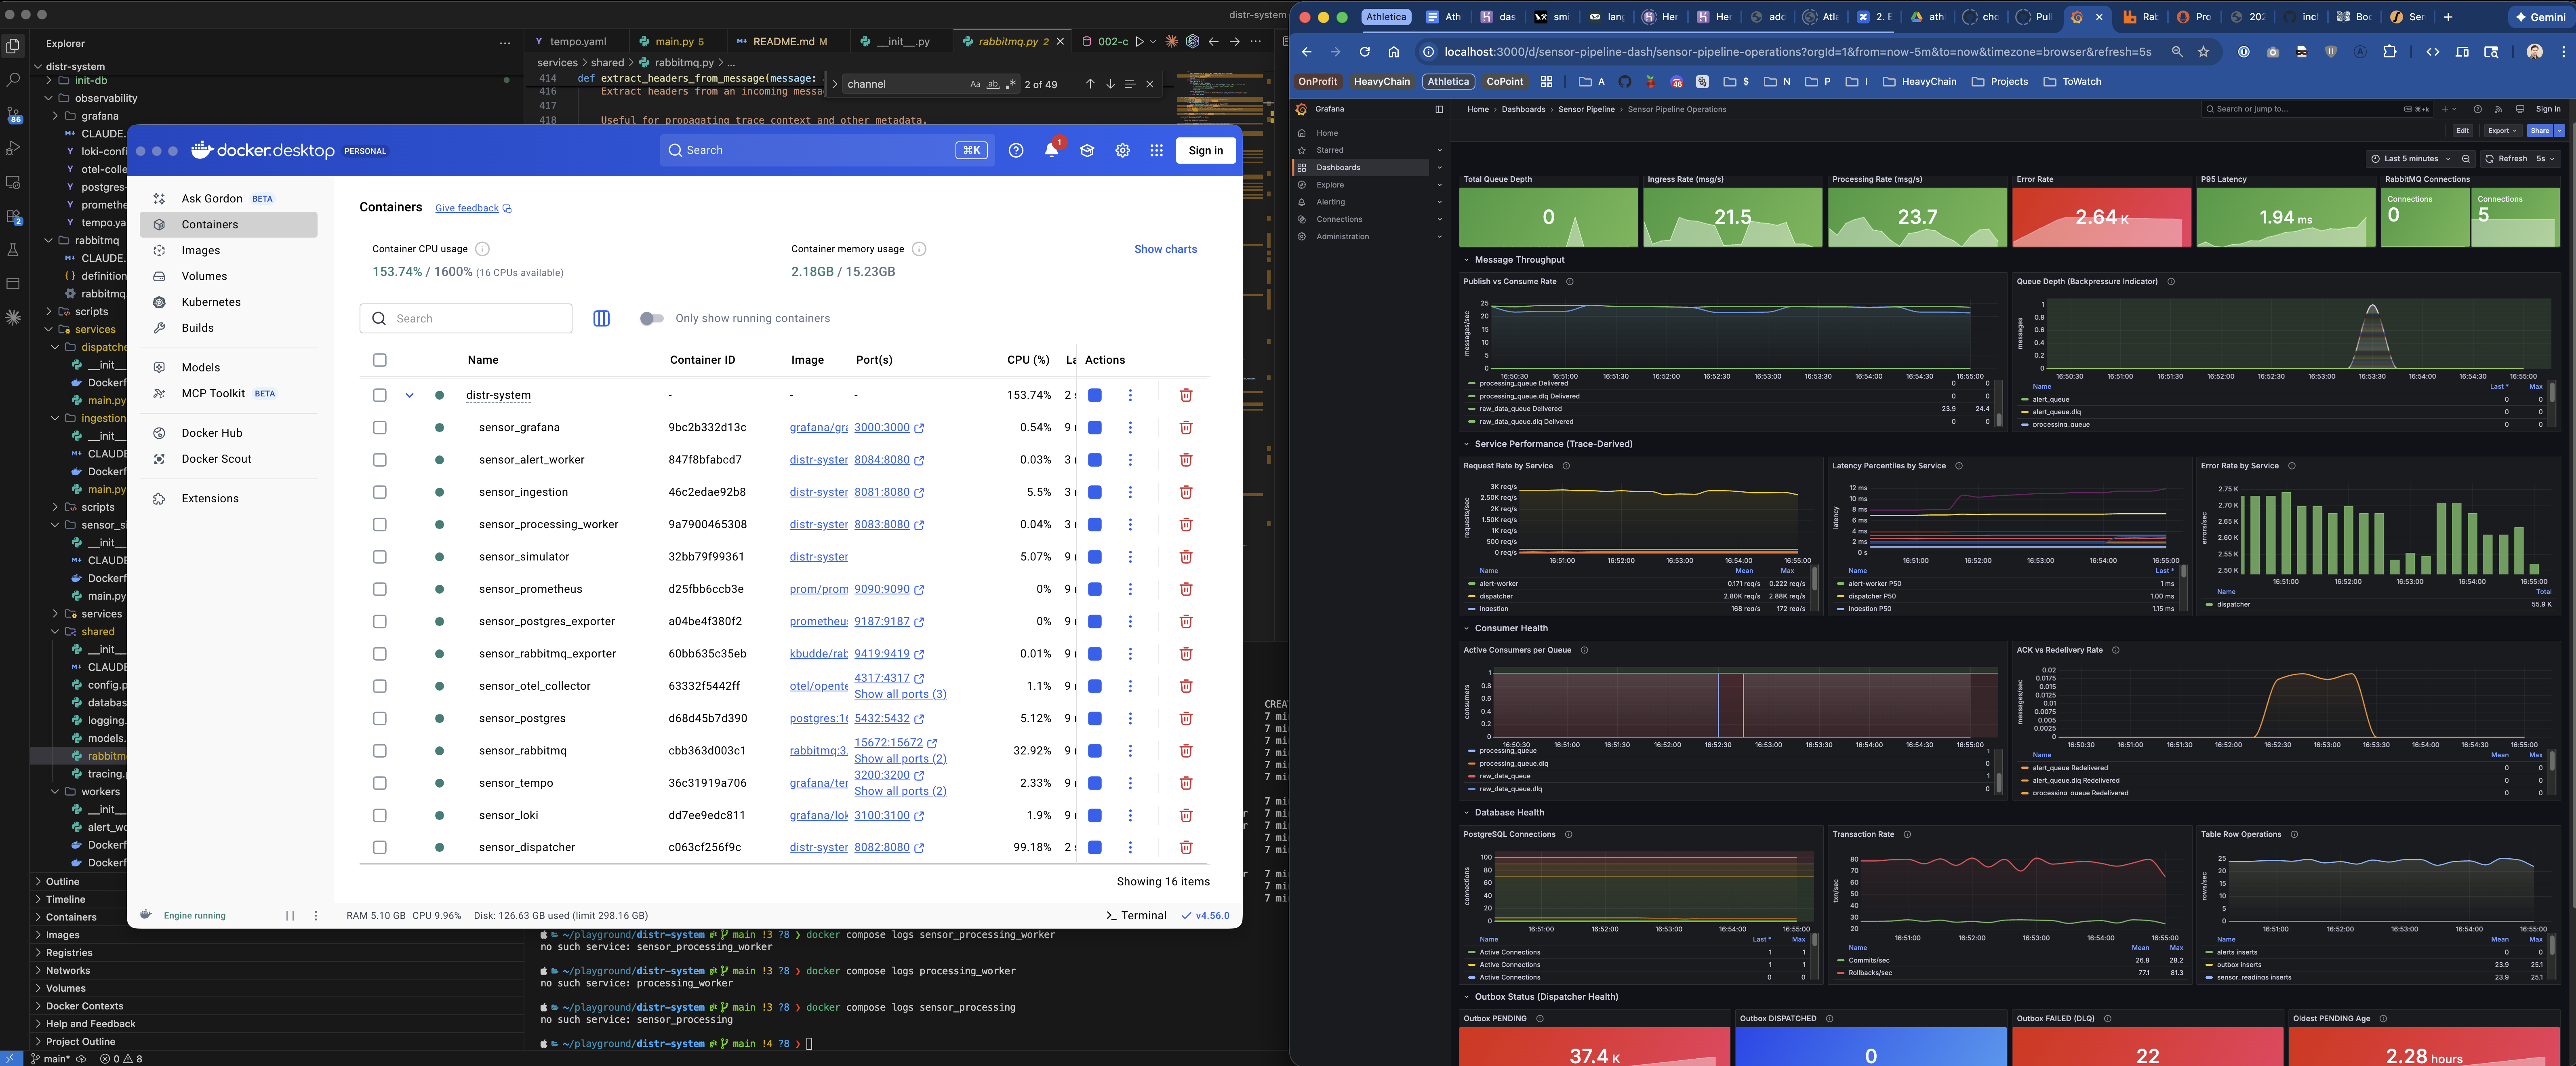
In this three-part series, I’m going to walk you through how to use this repository to learn core distributed systems concepts. First up: The Architecture & Backpressure.
The Architecture
Before we run any commands, let's look at the map. This isn't a toy "Hello World" app; it's a realistic event-driven pipeline.
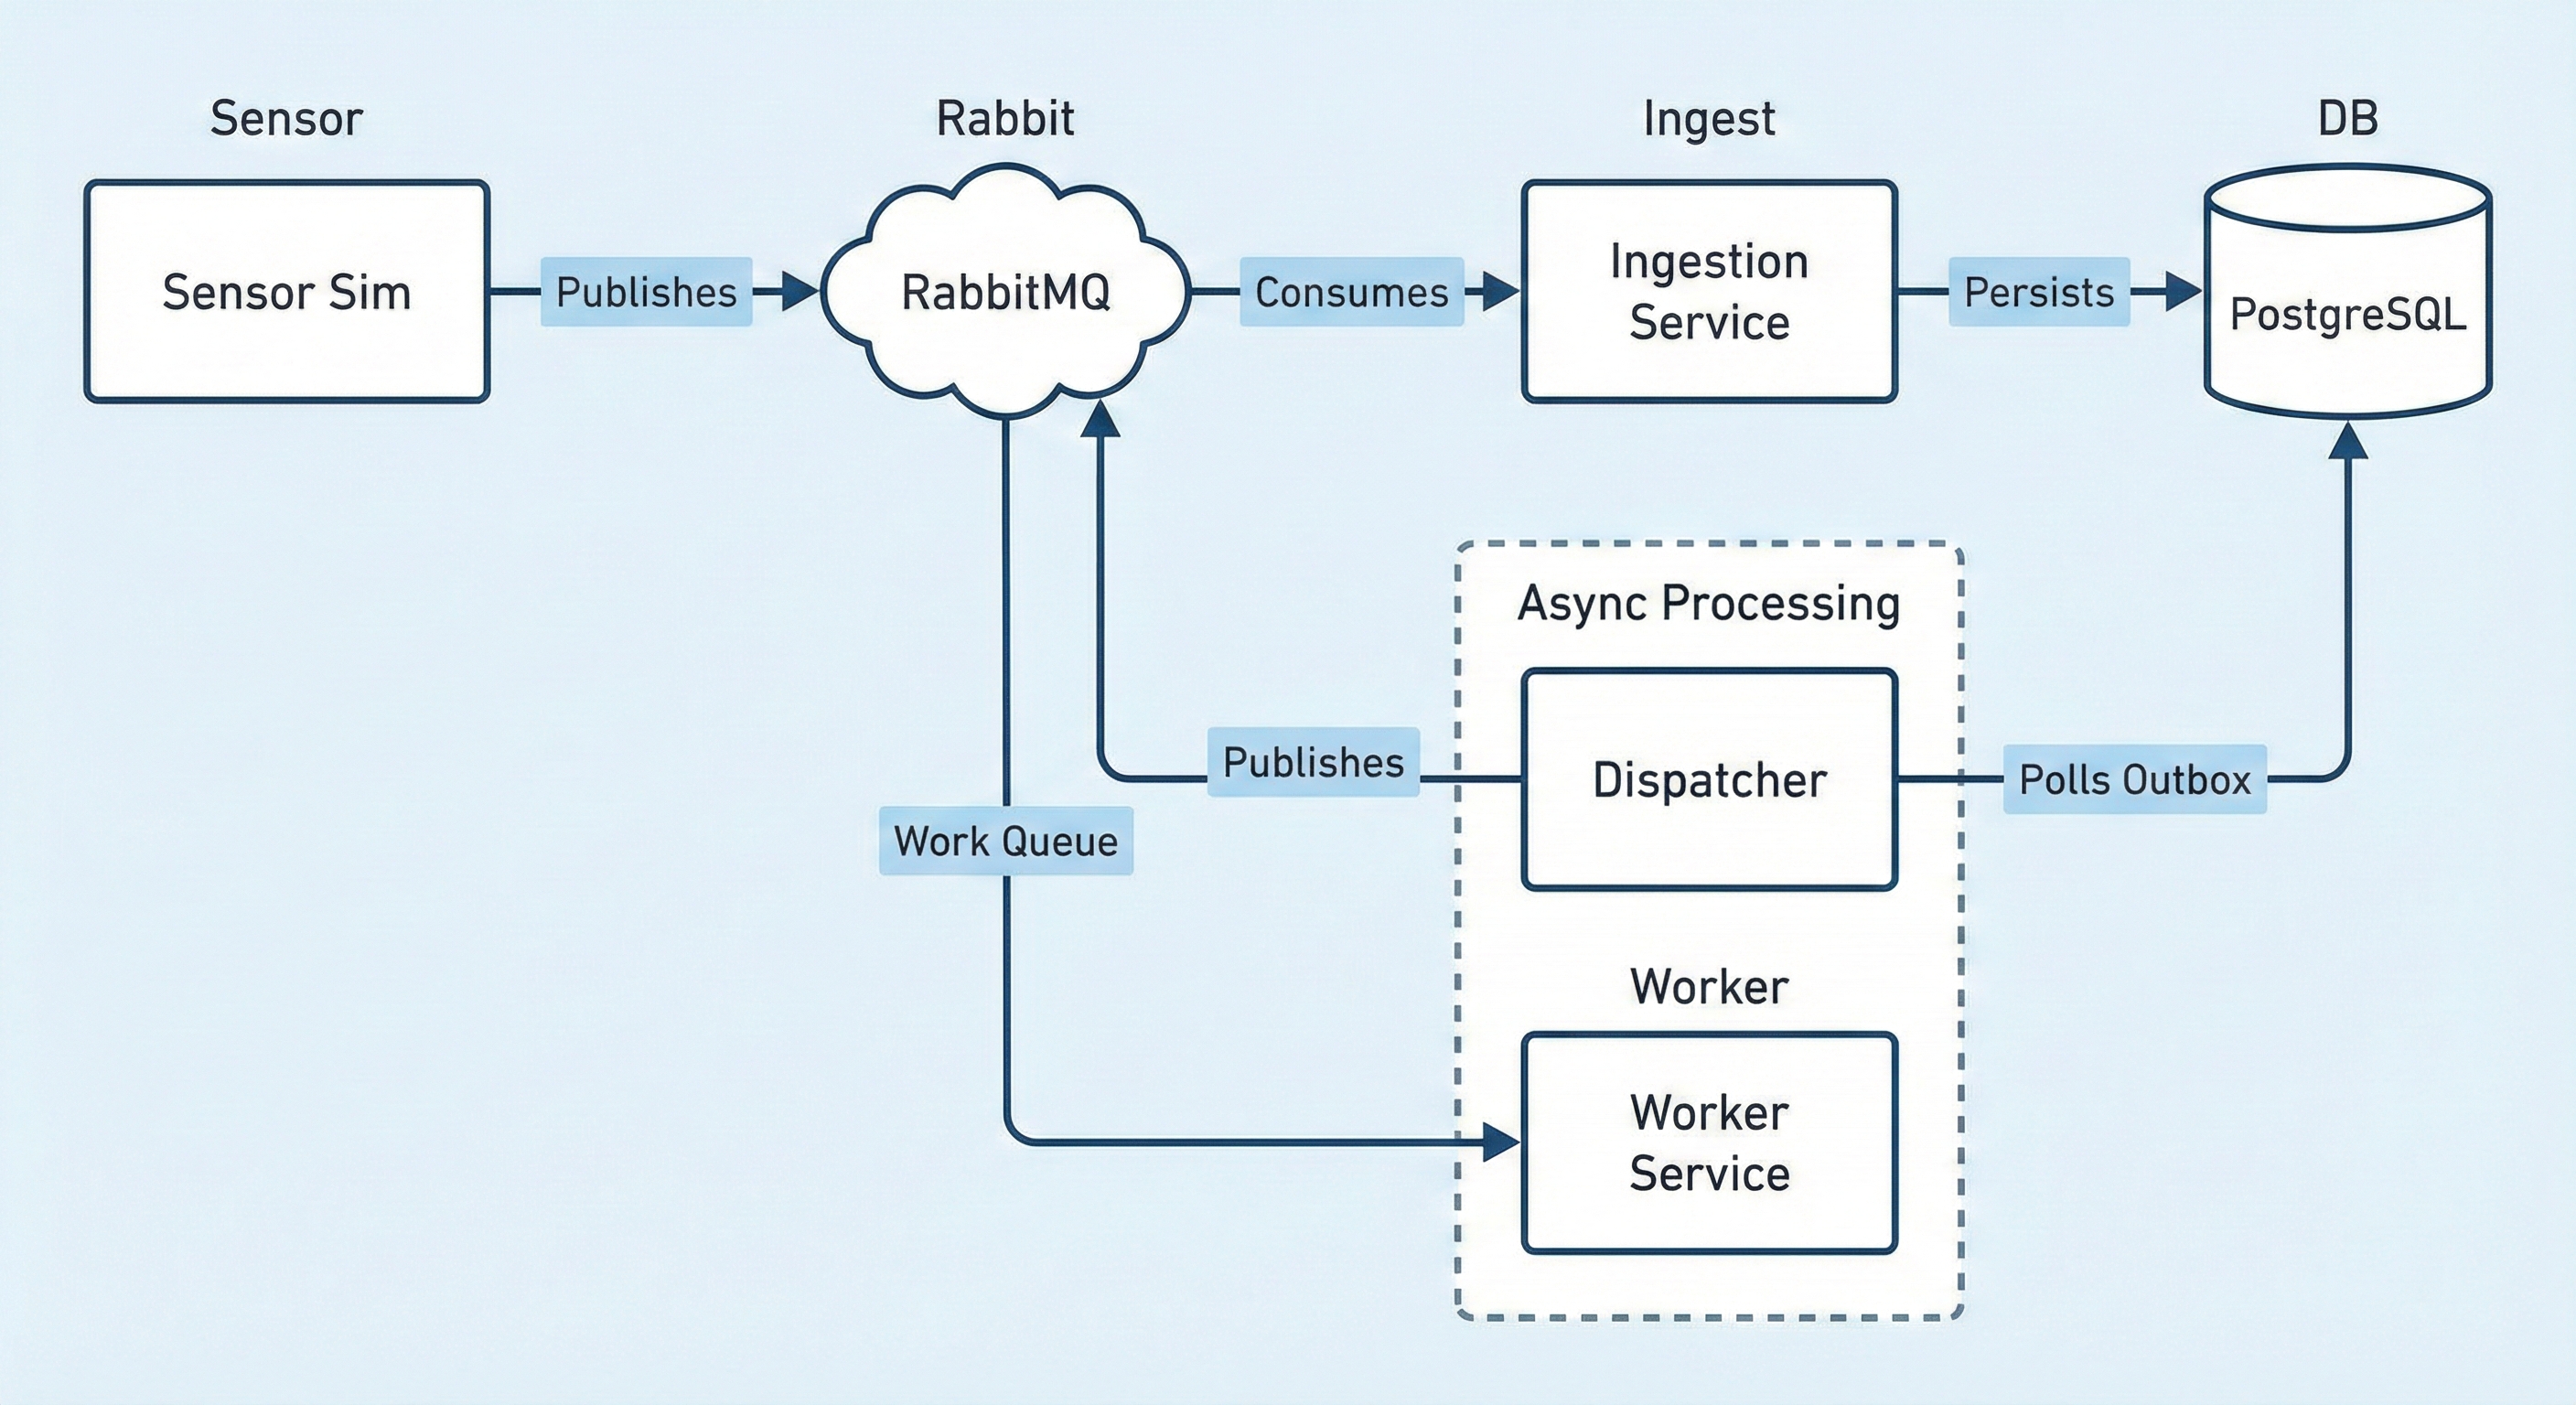
The system is composed of these key players:
Sensor Sim (The Producer): This generates dummy telemetry data. It is highly configurable via environment variables in the
docker-compose.ymlfile. You can: increase the messages per second to load test the system; Enable "Burst Mode" to simulate spikey traffic patterns; Adjust payload sizes.RabbitMQ (The Transport): We use a proper Exchange/Queue setup here. The producer sends to an Exchange, which routes to Queues. This decoupling is vital—the producer doesn't care if the database is down; it just hands the message to the broker.
Ingestion Service (The Consumer): This service listens to the queue, validates data, and writes it to storage.
PostgreSQL (The Source of Truth): Where our data lives.
The Observability Stack: Prometheus (metrics), Grafana (dashboards), and Tempo (tracing) are watching every move.
Getting Started: Stand Up the Stack
You can grab the code here: https://github.com/inchoate/distr-system.
Once you have the repo, standing it up is a one-liner:
docker compose up -d
The Control Plane: Docker Dashboard
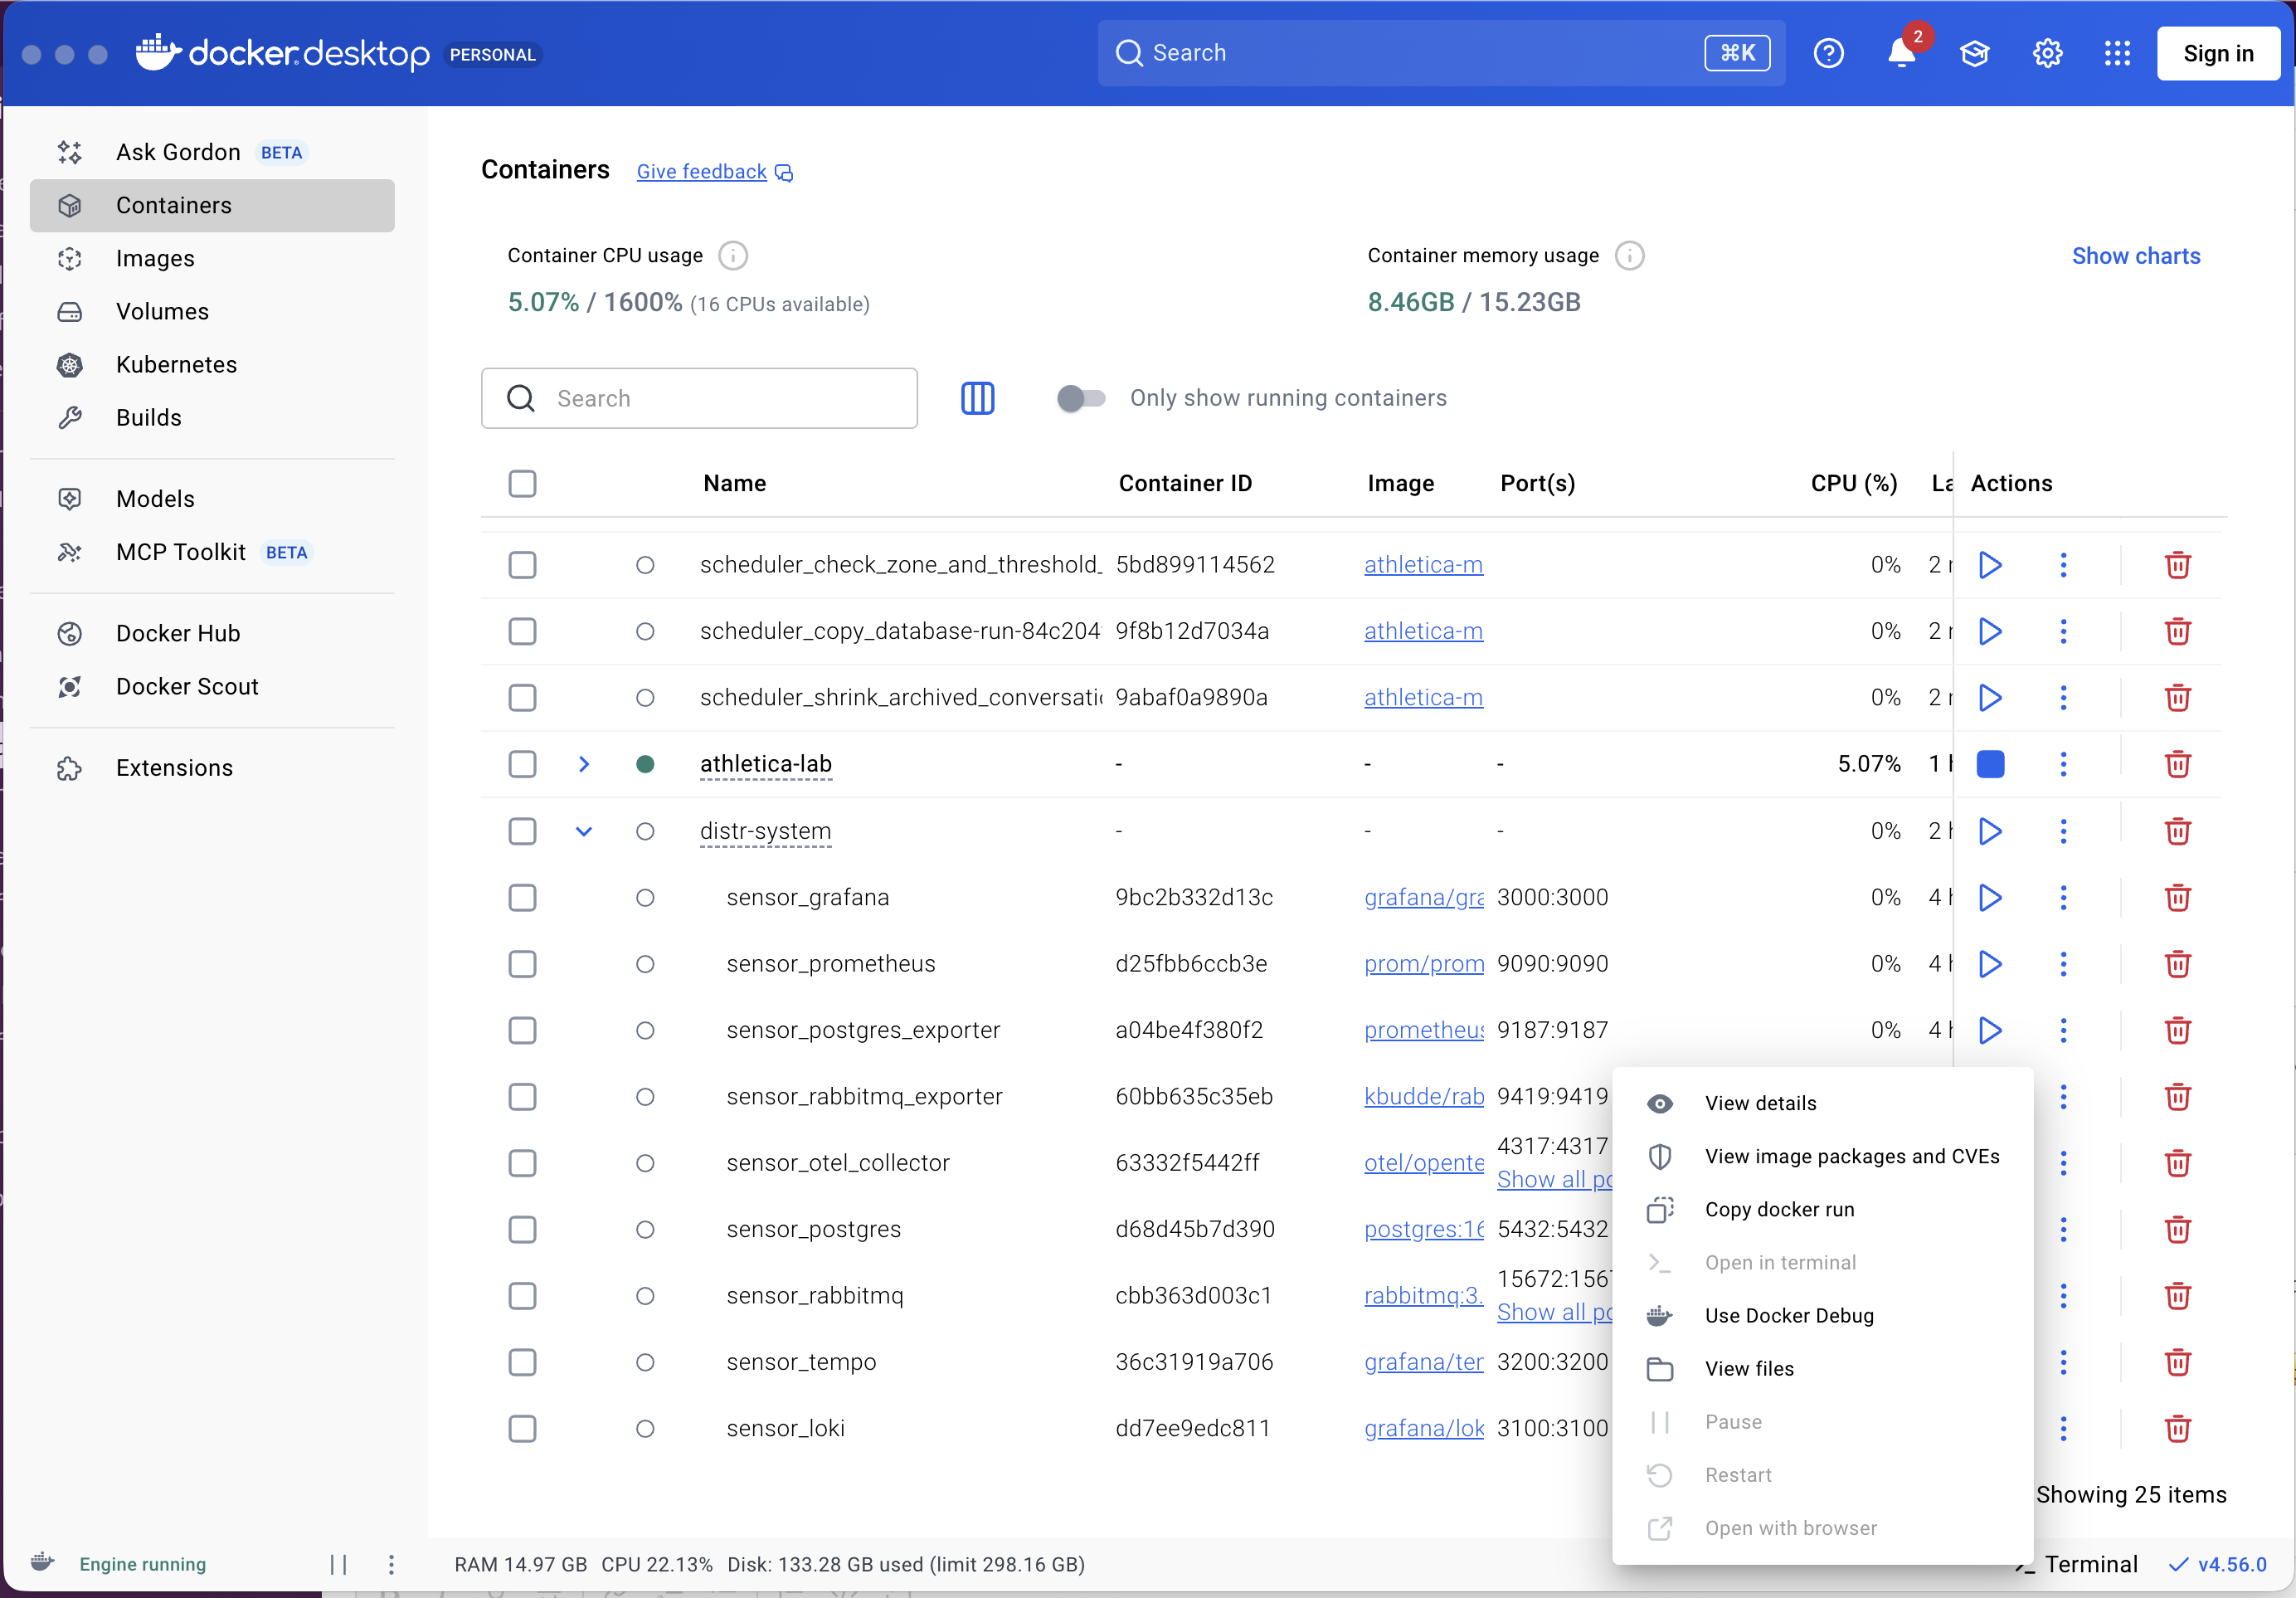
While you can use the CLI, I highly recommend opening the Docker Desktop Dashboard. This is your "Mission Control." From this view, you can:
Check Stats: You can see CPU and Memory usage in real-time. This is a great way to spot which service is struggling under load.
View Logs: Click on any container to see its real-time output without needing to tail logs in a terminal.
Pause/Unpause: This is our primary tool for experiments. You can "freeze" a service to simulate a hang without killing the process.
The Observability Plane: Grafana
Once the stack is green, open your browser to http://localhost:3000. You will see the System Overview dashboard. You should see the "Message Rate" climbing and the "Queue Depth" flatlining near zero. This indicates a healthy system in equilibrium.
Experiment 1: Visualizing Backpressure
Now that we are running, let's learn something. We are going to explore Backpressure.
In a healthy system, the consumer (Ingestion Service) keeps up with the producer (Sensor Sim). But if the consumer slows down or stops, that data has to go somewhere. In a resilient system, it accumulates in a buffer (the Queue).
Step 1: "Little's Law"
There is a famous rule in queuing theory called Little's Law: L = λW.
L = Items in the queue.
λ = Arrival rate (how fast sensors are sending data).
W = Wait time (processing time).
Think of it like a coffee shop. If the barista stops making coffee (W becomes infinite), but customers keep walking in the door (λ stays constant), the line (L) must grow to infinity.
Let's prove this law in our sandbox.
Step 2: Apply the Pressure
We’re going to simulate the Ingestion Service hanging (perhaps due to a Garbage Collection pause or a deadlock).
Open Docker Dashboard.
Find the
sensor_ingestioncontainer.Click the Pause button (or the pause icon).
*Alternatively, use the CLI: docker compose pause sensor_ingestion*
The service is now frozen. It cannot process work. However, the Sensor Sim is still running, happily pumping data into RabbitMQ.
Step 3: The Observation
Switch to Grafana. Watch the Raw Data Queue panel.
You will see the line start to climb diagonally.
The Producer: Running at constant speed.
The Consumer: Stopped (0 messages/sec).
The Result: The queue acts as a shock absorber. The system hasn't crashed; it is simply storing the pressure.
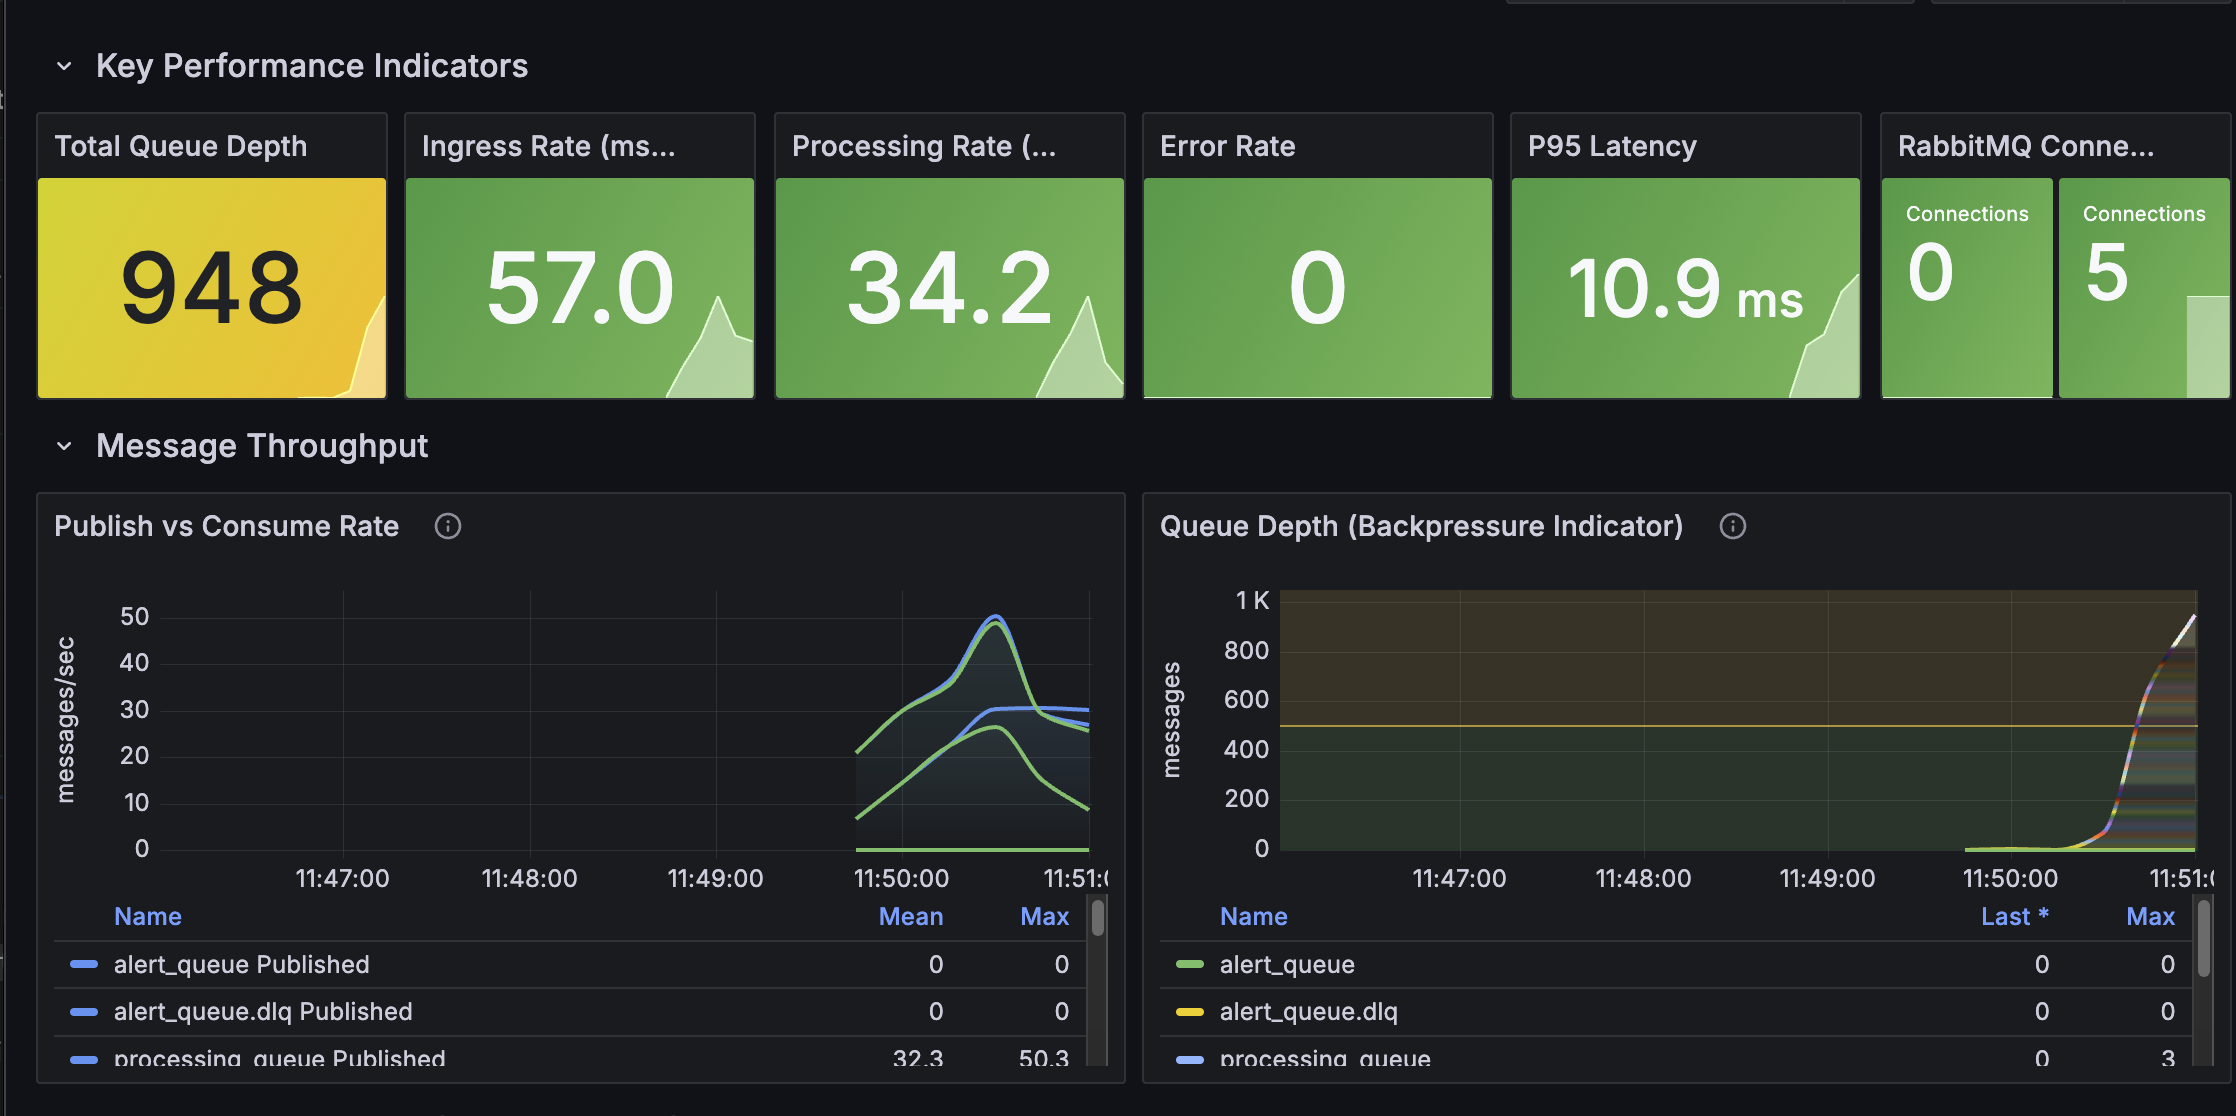
I just paused ingestion. You see the queue depth increasing. The total queue depth card turns yellow, warning us.
Step 4: Recovery
Go back to Docker Dashboard and click Unpause (Play button).
Watch Grafana. The Ingestion Service wakes up, sees the backlog, and immediately starts consuming at max capacity. The queue depth drops sharply back to zero.
Outside Reading
Focus: The left side of the diagram. How do we get high-velocity data from sensors into our system without overwhelming the database immediately?
Diagram Scope: Sensor Sim → RabbitMQ → Ingestion Service
Topics to Investigate:
Decoupling Producers & Consumers: Why put a queue in the middle? The benefits of asynchronous communication versus synchronous REST/gRPC calls for sensor data.
RabbitMQ Fundamentals:
The AMQP Model: Producers, Consumers, Exchanges, Queues, and Bindings.
Exchange Types: Direct vs. Fanout vs. Topic (Which one fits sensor data?).
Message Durability: Ensuring messages aren't lost if the broker restarts before consumption.
Consumer Fundamentals (Ingestion Service):
Long-running processes vs. on-demand functions (FaaS).
Message Acknowledgement (ACKs and NACKs): Telling RabbitMQ you've successfully received the data.
Why this matters
You just visualized the most fundamental protection mechanism in distributed systems. By using a queue, we converted a hard failure (service down) into latency (processing delayed).
In the next post, we’ll try something riskier: we’re going to kill the message broker entirely and see how to prevent data loss using the Transactional Outbox pattern.
In the meantime, look at the sensor simulator code. Adjust the generator rate, burst mode, etc, to see how the system responds.